CBOE Volatility Index
The VIX measures the market's expectation of 30-day forward-looking volatility, derived from S&P 500 index options. Often called the 'fear gauge,' it rises during periods of market uncertainty.
Near-term seasonal signals lean toward fading fear. Over the next 30 days, the last 10 consecutive years show VIX rising in only 2 of 10 periods, with a median decline of 9.95% pointing toward 17.67. Midterm election years tell a different story at longer horizons: VIX rose in 5 of 8 periods over 60 and 90 days, with median gains of 7.53% and 8.65% respectively, signaling toward 20.12 and 23.29.
The divergence is the key insight. Short-term calm may give equities breathing room, but midterm election seasonality historically reintroduces volatility by late summer and fall. Investors should treat any continued VIX compression now as a window of stability, not a permanent condition, with elevated uncertainty likely returning as election uncertainty builds.
Seasonal Price Projections
Select a historical basis and projection horizon to see where seasonal patterns suggest CBOE Volatility Index may be headed.
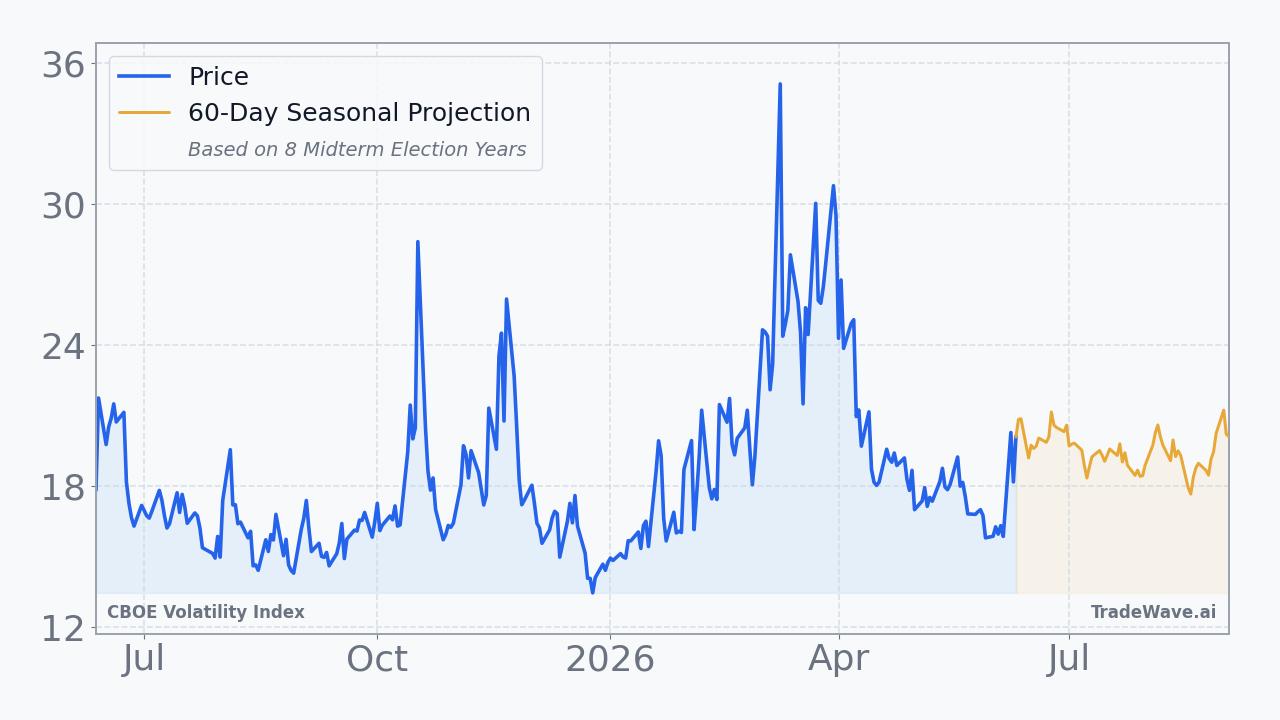
Projection as of Jun 12, 2026 from closing price $19.44
How to Use This Data
Seasonal projections for the CBOE Volatility Index show how VIX has historically behaved during this same calendar period across past years. In standard consecutive periods, VIX increased in 40.0% of cases, suggesting relative calm was more common. In midterm election years specifically, VIX increased in 62.5% of periods, signaling that election cycles have historically corresponded with elevated market anxiety.
The two projection bases currently diverge, with consecutive history projecting a return of -4.0% and the price-earnings basis projecting +0.1%. When bases point in opposite directions, neither signal carries the same weight it would if both aligned. The median return often provides cleaner context than the average, since extreme years like the historical peak of +72.0% can distort averages significantly.
Historical patterns cannot account for sudden geopolitical developments, policy shifts, earnings surprises, or breaking macroeconomic news. A 62.5% historical increase rate does not guarantee VIX will rise in any given year. These figures represent statistical tendencies drawn from limited historical samples, not forward-looking forecasts.
Seasonal VIX data serves as one diagnostic lens among many. Market participants often combine it with technical analysis, macroeconomic indicators, and portfolio risk frameworks to build a broader picture of potential equity market conditions in the period ahead.
This information is provided for educational purposes only and does not constitute financial advice, a recommendation, or a solicitation to buy or sell any security. Seasonal patterns are based on historical data and do not guarantee future performance. All investment decisions carry risk. Consult a qualified financial advisor before making investment decisions.
Understanding Seasonal Projections
Seasonal projections estimate future price movement based on how CBOE Volatility Index has historically performed during the same calendar period. These are statistical baselines derived from decades of market data, not predictions.
Consecutive Years (Last 10)
Uses the most recent 10 years of data regardless of market regime. This captures the broadest recent behavior, including all economic and political environments. Over the next 60 trading days, this pattern has been positive 4 of 10 times with an average return of +2.8%.
Midterm Election Years (8 Available)
Uses only years that fall in the same position within the 4-year U.S. presidential election cycle. 2026 is a midterm election year. Markets often exhibit distinct patterns tied to fiscal and monetary policy shifts within this cycle. In 8 historical midterm election years, this 60-day window was positive 5 times with an average return of +5.6%.
Seasonal patterns reflect historical tendencies and do not guarantee future results. All projections are based on past performance and should be used as one input among many in your investment decision-making process. Data provided by TradeWave.ai.
Latest News
Recent headlines related to CBOE Volatility Index, sourced from major financial news outlets with AI sentiment analysis.
- Technical Damage to the Bull Market Is Building. SpaceX Will Make It Worse.
- Market Fear Index Dips as Tech Stocks Rebound
- Broadcom and AMD Sink 4%, NVIDIA Slides 3% as the Chip Selloff Deepens
- ETFs That May Provide Investors Protection From Market Risks
- A Closer Look at an Unusual S&P 500 Pullback
- Market Fear Index Jumps as AI Worries Build
- Nasdaq Slips 1.8%, Bounces Off Earlier Lows
- Stock Market Today: Nasdaq Sinks As Tech Rally Fizzles; Finance Stocks Break Out (Live Coverage)
- Market Fear Index Slips as Tech Rebound Rages On
- Market Fear Index Slides as Investors Pile Back Into Tech Stocks
Explore More
Other markets with seasonal analysis and recent pattern articles.