NASDAQ Composite
The NASDAQ Composite index includes over 3,000 stocks listed on the Nasdaq exchange, heavily weighted toward technology and growth companies.
The most striking divergence in NASDAQ seasonal data right now is the collision between two powerful signals. The last 10 consecutive years show a flawless 30-day win rate of 100%, projecting a 14.13% gain to 29,117. Yet midterm election years tell the opposite story, with only a 38.5% win rate and an average 30-day loss of 1.13%, targeting 24,234.
That tension defines the setup. NASDAQ's growth-heavy composition amplifies both election-cycle volatility and momentum rallies, making the midterm headwind historically more severe here than in broader indexes. The 90-day midterm projection shows a 13.63% decline with a worst case of negative 29%. Watch whether the index holds current levels through the next 30 days as the deciding signal.
Seasonal Price Projections
Select a historical basis and projection horizon to see where seasonal patterns suggest NASDAQ Composite may be headed.
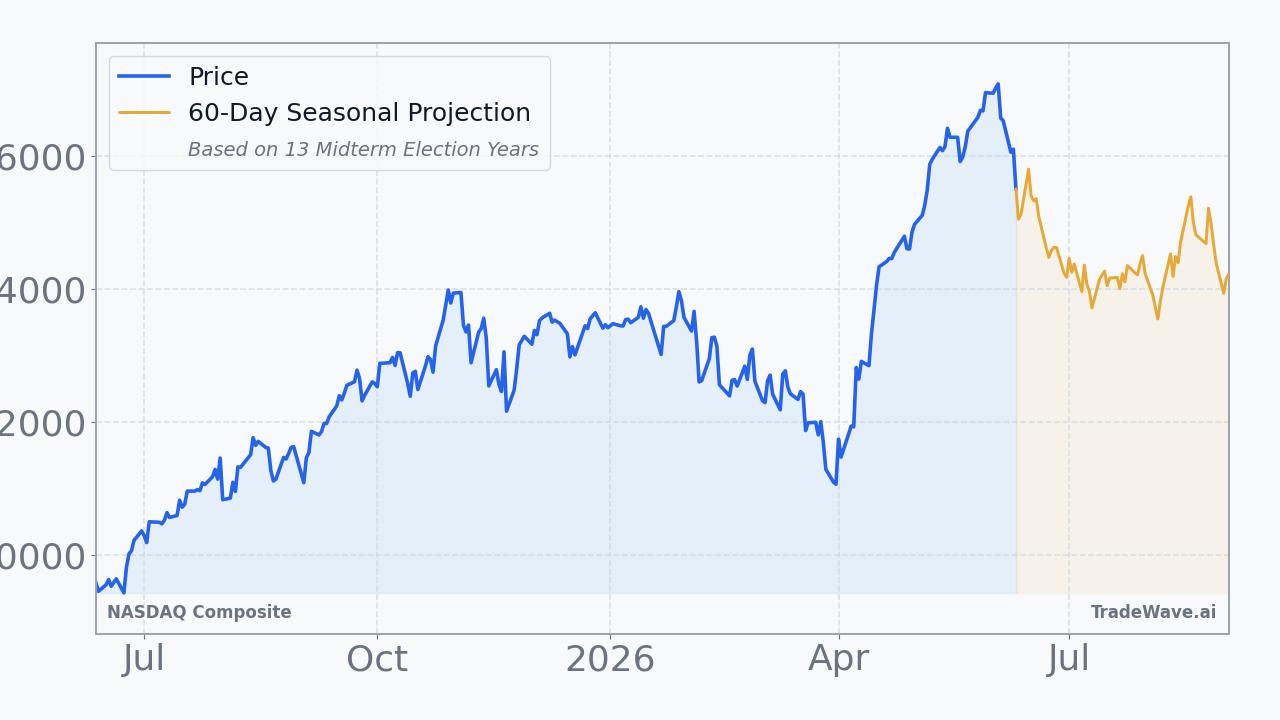
Projection as of Jun 12, 2026 from closing price $25,809.66
How to Use This Data
Seasonal projection data for the NASDAQ Composite reflects how the index has historically performed during this same calendar period across prior years. The consecutive pattern carries a 90.0% win rate, meaning the index closed higher in 90 out of roughly 100 comparable historical windows. The midterm election year pattern tells a notably different story, with only a 38.5% win rate over those specific cycles.
When two bases point in opposite directions, as they do here, it signals that the election cycle environment has historically produced meaningfully different outcomes than the broader consecutive pattern alone would suggest. The median return is often more reliable than the average because a single extreme year can skew the average significantly, while the median reflects the more typical middle outcome across all historical instances.
Seasonal patterns are built entirely from historical price behavior and cannot incorporate current conditions such as earnings surprises, Federal Reserve policy shifts, geopolitical developments, or breaking economic news. A 90.0% win rate still leaves a meaningful probability of a down period, and no statistical tendency guarantees any specific outcome in a given year.
Market participants often use seasonal data as one layer of context alongside fundamental research, technical analysis, and broader macroeconomic awareness. It can help frame expectations about historical tendencies during a given period, but it functions as background context rather than a standalone decision-making tool.
This information is provided for educational purposes only and does not constitute financial advice, a recommendation, or a solicitation to buy or sell any security. Seasonal patterns are based on historical data and do not guarantee future performance. All investment decisions carry risk. Consult a qualified financial advisor before making investment decisions.
Understanding Seasonal Projections
Seasonal projections estimate future price movement based on how NASDAQ Composite has historically performed during the same calendar period. These are statistical baselines derived from decades of market data, not predictions.
Consecutive Years (Last 10)
Uses the most recent 10 years of data regardless of market regime. This captures the broadest recent behavior, including all economic and political environments. Over the next 60 trading days, this pattern has been positive 9 of 10 times with an average return of +5.2%.
Midterm Election Years (13 Available)
Uses only years that fall in the same position within the 4-year U.S. presidential election cycle. 2026 is a midterm election year. Markets often exhibit distinct patterns tied to fiscal and monetary policy shifts within this cycle. In 13 historical midterm election years, this 60-day window was positive 5 times with an average return of -2.1%.
Seasonal patterns reflect historical tendencies and do not guarantee future results. All projections are based on past performance and should be used as one input among many in your investment decision-making process. Data provided by TradeWave.ai.
Latest News
Recent headlines related to NASDAQ Composite, sourced from major financial news outlets with AI sentiment analysis.
- Gap and Sally Beauty Stocks Trade Up, What You Need To Know
- Dow Jones Futures: SpaceX IPO To Launch After Trump Market Rally
- OneWater, CarMax, and Dillard's Shares Skyrocket, What You Need To Know
- Why Target (TGT) Stock Is Up Today
- America's Car-Mart, Kohl's, and Macy's Shares Are Soaring, What You Need To Know
- Boot Barn, Ollie's, and Williams-Sonoma Shares Are Soaring, What You Need To Know
- Burlington, Victoria's Secret, and Genuine Parts Shares Skyrocket, What You Need To Know
- Western Digital and Allegro MicroSystems Stocks Trade Up, What You Need To Know
- CrowdStrike and Cloudflare Stocks Trade Up, What You Need To Know
- Abercrombie and Fitch and Urban Outfitters Shares Are Soaring, What You Need To Know
Explore More
Other markets with seasonal analysis and recent pattern articles.