Natural Gas
Henry Hub Natural Gas futures represent the benchmark price for natural gas in North America, heavily influenced by weather patterns and seasonal demand.
The divergence between general seasonal history and midterm election year patterns is stark for Natural Gas. While the last 10 consecutive years show a 90-day projected gain of 17.54% with a $3.63 target, midterm election years tell the opposite story: a 90-day projected loss of 20.17% toward $2.46, with a crushing 12.5% win rate across 8 historical instances. The near-term 30-day midterm signal is equally bearish, with only 1 of 8 years finishing positive.
Natural Gas is notoriously volatile and politically sensitive, making the election-cycle overlay particularly meaningful. The midterm pattern consistently overwhelms the broader seasonal trend across all three time horizons. Traders should watch storage reports and demand signals closely, as the commodity's history suggests significant downside pressure through this cycle.
Seasonal Price Projections
Select a historical basis and projection horizon to see where seasonal patterns suggest Natural Gas may be headed.
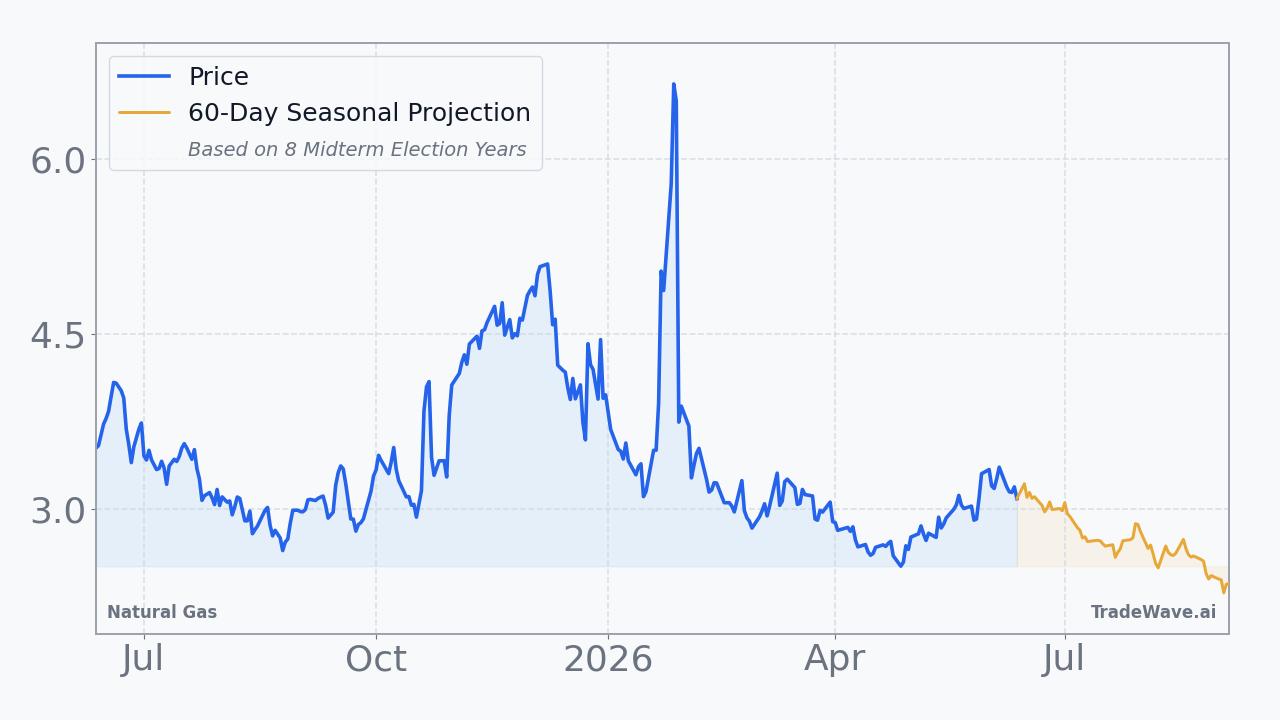
Projection as of Jun 12, 2026 from closing price $3.0860
How to Use This Data
Seasonal projection data reflects how Natural Gas has historically performed during this same calendar window across prior years. The consecutive pattern shows a 50.0% win rate, meaning prices finished higher in exactly half of those historical instances, while the midterm election year pattern shows a notably lower 37.5% win rate across those specific cycles.
When the two bases diverge as they do here, pointing in opposite directions with projected returns of +7.9% and -23.6% respectively, it signals that the election cycle context has historically produced meaningfully different outcomes than the broader consecutive pattern. The median return often provides a cleaner read than the average because it is less distorted by outlier years like the recorded extremes of +27.3% and -25.0%.
Seasonal patterns carry inherent limitations that users should understand clearly. Supply disruptions, weather events, policy shifts, geopolitical developments, and macroeconomic changes are entirely outside what historical calendar tendencies can capture, and a given win rate offers no guarantee about any individual year's outcome.
Market participants typically use seasonal data as one layer of context alongside fundamental supply and demand analysis, technical price levels, and portfolio risk parameters. Understanding historical tendencies during a specific period can help frame expectations and inform how other signals are interpreted, without substituting for comprehensive analysis.
This information is provided for educational purposes only and does not constitute financial advice, a recommendation, or a solicitation to buy or sell any security. Seasonal patterns are based on historical data and do not guarantee future performance. All investment decisions carry risk. Consult a qualified financial advisor before making investment decisions.
Understanding Seasonal Projections
Seasonal projections estimate future price movement based on how Natural Gas has historically performed during the same calendar period. These are statistical baselines derived from decades of market data, not predictions.
Consecutive Years (Last 10)
Uses the most recent 10 years of data regardless of market regime. This captures the broadest recent behavior, including all economic and political environments. Over the next 60 trading days, this pattern has been positive 5 of 10 times with an average return of +2.0%.
Midterm Election Years (8 Available)
Uses only years that fall in the same position within the 4-year U.S. presidential election cycle. 2026 is a midterm election year. Markets often exhibit distinct patterns tied to fiscal and monetary policy shifts within this cycle. In 8 historical midterm election years, this 60-day window was positive 3 times with an average return of -5.6%.
Seasonal patterns reflect historical tendencies and do not guarantee future results. All projections are based on past performance and should be used as one input among many in your investment decision-making process. Data provided by TradeWave.ai.
Latest News
Recent headlines related to Natural Gas, sourced from major financial news outlets with AI sentiment analysis.
- Analyst Trims Patterson-UTI Energy (PTEN) Price Target by $10
- Oneok Inc. (OKE) Stock Declines While Market Improves: Some Information for Investors
- APA (APA) Stock Sinks As Market Gains: Here's Why
- Archrock Inc. (AROC) Advances But Underperforms Market: Key Facts
- FreightWaves Today: U.S. approves $5B offshore LNG export platform
- Sector Update: Energy
- Is Archrock, Inc. (AROC) A Good Stock To Buy Now?
- Sector Update: Energy Stocks Mixed Thursday Afternoon
- Is Most-Watched Stock Archrock, Inc. (AROC) Worth Betting on Now?
- Here is What to Know Beyond Why Enbridge Inc (ENB) is a Trending Stock
Explore More
Other markets with seasonal analysis and recent pattern articles.