Gold
COMEX Gold futures are the world's most liquid gold contract. Gold serves as a store of value, inflation hedge, and safe-haven asset during periods of geopolitical uncertainty.
The seasonal picture for gold splits sharply depending on which lens you apply. Broad 10-year history shows improving odds over longer horizons, with a 60% win rate at 90 days and an average return of +2.92%. But filter for midterm election years and the signal flips hard: only 1 of 6 prior midterm cycles produced a positive 90-day return, with an average loss of 2.91% and a projected target near $3,683.
Gold's political-cycle sensitivity is the key variable here. The metal tends to consolidate or correct during midterm years as policy uncertainty peaks and then resolves. With price already up sharply at $4,209, traders should watch whether that momentum holds through the 30-day window, where midterm win rates collapse to just 33%.
Seasonal Price Projections
Select a historical basis and projection horizon to see where seasonal patterns suggest Gold may be headed.
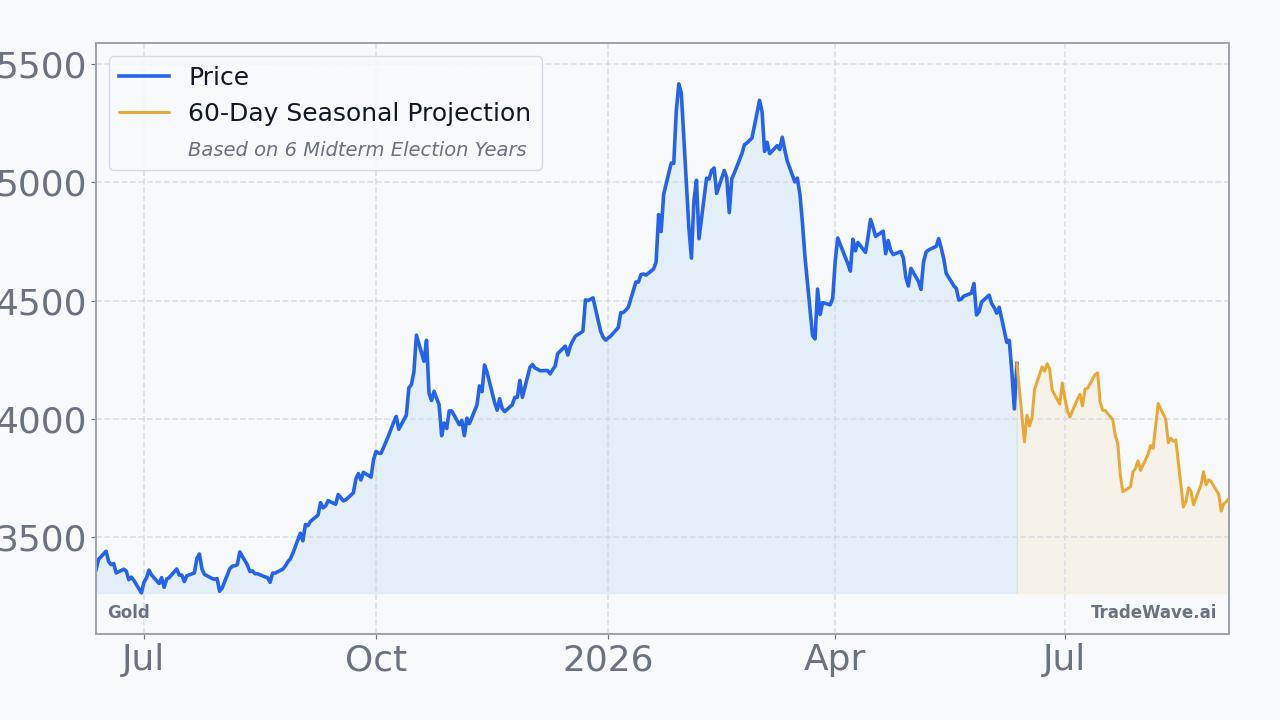
Projection as of Jun 12, 2026 from closing price $4,209.90
How to Use This Data
Seasonal projection data for Gold reflects how the commodity has historically performed during this specific calendar window across multiple years. The consecutive pattern shows a 50.0% win rate, meaning Gold finished higher in exactly half of those historical instances, with an average return of +1.7% and a median of +0.5%.
When the two bases diverge, as they do here, it signals that the midterm election year cycle has historically produced meaningfully different outcomes than the broader consecutive pattern. The midterm base shows a 33.3% win rate and a median return of -2.0%, which is worth noting because the median is less distorted by outlier years than the average return figure.
Seasonal patterns are built entirely from historical price behavior and cannot incorporate current events, central bank policy shifts, geopolitical developments, or sudden changes in supply and demand. A 50.0% win rate is not a guarantee of any outcome in any individual year, and the projected returns of +7.8% and -13.4% represent statistical tendencies drawn from a limited sample.
Market participants often use seasonal data as one layer of context alongside technical analysis, macroeconomic indicators, and fundamental research. Understanding historical tendencies can help frame expectations and timing considerations, but no single data source captures the full picture of what drives commodity prices in any given period.
This information is provided for educational purposes only and does not constitute financial advice, a recommendation, or a solicitation to buy or sell any security. Seasonal patterns are based on historical data and do not guarantee future performance. All investment decisions carry risk. Consult a qualified financial advisor before making investment decisions.
Understanding Seasonal Projections
Seasonal projections estimate future price movement based on how Gold has historically performed during the same calendar period. These are statistical baselines derived from decades of market data, not predictions.
Consecutive Years (Last 10)
Uses the most recent 10 years of data regardless of market regime. This captures the broadest recent behavior, including all economic and political environments. Over the next 60 trading days, this pattern has been positive 5 of 10 times with an average return of +1.7%.
Midterm Election Years (6 Available)
Uses only years that fall in the same position within the 4-year U.S. presidential election cycle. 2026 is a midterm election year. Markets often exhibit distinct patterns tied to fiscal and monetary policy shifts within this cycle. In 6 historical midterm election years, this 60-day window was positive 2 times with an average return of -1.2%.
Seasonal patterns reflect historical tendencies and do not guarantee future results. All projections are based on past performance and should be used as one input among many in your investment decision-making process. Data provided by TradeWave.ai.
Latest News
Recent headlines related to Gold, sourced from major financial news outlets with AI sentiment analysis.
- Is Agnico Eagle Mines (AEM) Using Its Renewed Buyback To Redefine Capital Resilience?
- CME Group to Expand 24/7 Trading for WTI Crude Oil and Gold
- TSX Closer: The Index Advances Despite Weak Building Permit Data; Gold Rebounds
- Is Fortuna Mining Corp. (FSM) A Good Stock To Buy Now?
- Gold Mining Stock Poised for a Short-Term Bounce
- Three Forces Just Pushed Gold to Its Worst Quarter in a Decade
- Inflation Hasn't Been This High Since 2023. Could Gold Be Due to Rise Higher This Year?
- SpaceX IPO to launch this group of teachers into dream retirement — massive $11B jackpot possible. How to ride the wave
- OceanaGold (TSX:OGC) Valuation Check After Recent Share Price Weakness
- AEM Trades at a Premium Valuation: Here's How to Play the Stock
Explore More
Other markets with seasonal analysis and recent pattern articles.