S&P 500
The S&P 500 index tracks 500 of the largest U.S. publicly traded companies, weighted by market capitalization. It is widely regarded as the best single gauge of the U.S. equity market.
The recent 10-year seasonal record for this period is nearly flawless: a 100% win rate over both 30-day and 90-day windows, projecting gains of 12.20% and 12.36% respectively from current levels. The 60-day window shows 9 of 10 positive outcomes. That consistency is exceptional by any measure.
The midterm election year lens tells a sharply different story. Win rates collapse to 50% or below across all three horizons, with projected returns turning negative at every interval, reaching as low as -6.79% over 90 days. This divergence is the central tension right now. The broad seasonal tailwind is strong, but 2026's political cycle introduces meaningful historical headwinds. Watch whether early-year momentum can override the midterm drag.
Seasonal Price Projections
Select a historical basis and projection horizon to see where seasonal patterns suggest S&P 500 may be headed.
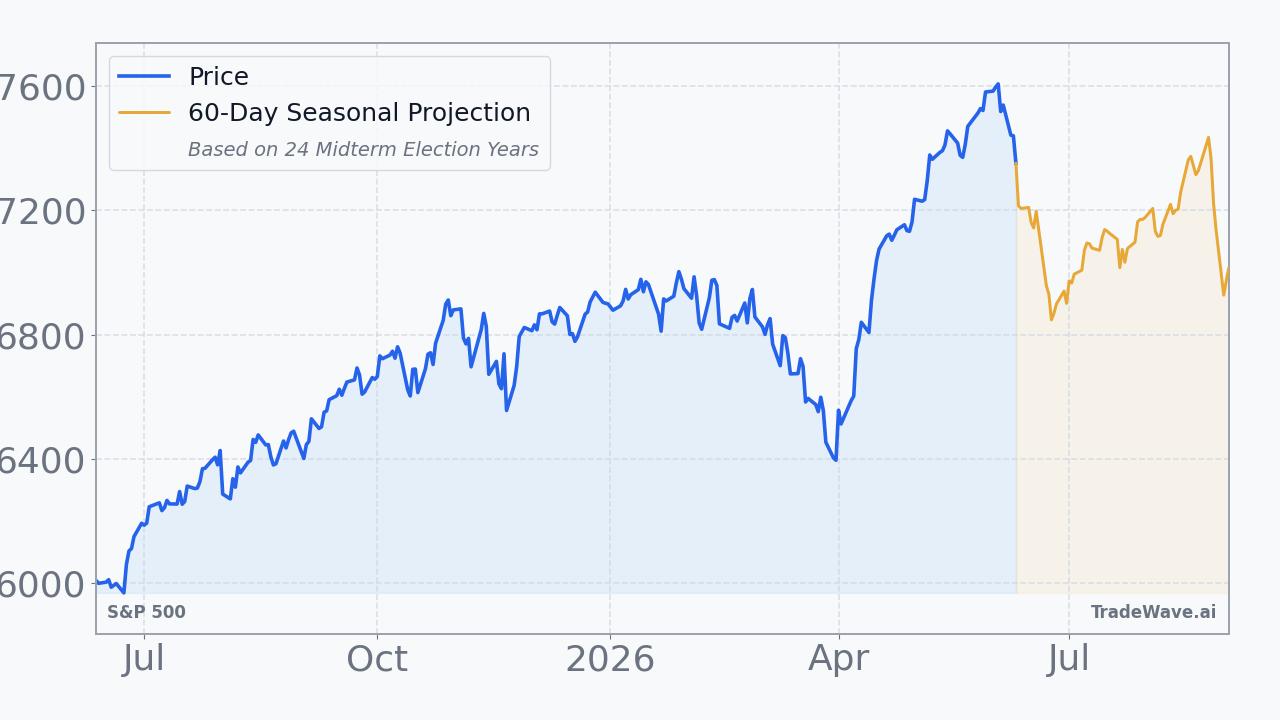
Projection as of Jun 12, 2026 from closing price $7,394.30
How to Use This Data
Seasonal projection data shows how the S&P 500 has historically performed during this same calendar window across prior years. The consecutive pattern carries a 90.0% win rate, meaning the index closed higher in 9 out of 10 comparable periods, with an average return of 4.0% and a median of 3.6%.
When the two bases diverge as sharply as they do here, the picture becomes more complex. The midterm election year pattern shows only a 45.8% win rate and a near-flat median return, suggesting the election cycle has historically created meaningfully different conditions. The median return is often more informative than the average because it is less distorted by a small number of extreme years in either direction.
Historical patterns cannot account for breaking news, policy shifts, earnings surprises, or geopolitical developments that may unfold during any given period. A 90.0% win rate reflects past tendencies, not a guarantee, and the projection is a statistical summary rather than a forecast of what will happen this year.
Market participants often use seasonal data as one lens among several, pairing it with fundamental analysis, technical indicators, and an understanding of current macro conditions. Diverging bases like these are a signal to examine the full picture rather than rely on any single pattern.
This information is provided for educational purposes only and does not constitute financial advice, a recommendation, or a solicitation to buy or sell any security. Seasonal patterns are based on historical data and do not guarantee future performance. All investment decisions carry risk. Consult a qualified financial advisor before making investment decisions.
Understanding Seasonal Projections
Seasonal projections estimate future price movement based on how S&P 500 has historically performed during the same calendar period. These are statistical baselines derived from decades of market data, not predictions.
Consecutive Years (Last 10)
Uses the most recent 10 years of data regardless of market regime. This captures the broadest recent behavior, including all economic and political environments. Over the next 60 trading days, this pattern has been positive 9 of 10 times with an average return of +4.0%.
Midterm Election Years (24 Available)
Uses only years that fall in the same position within the 4-year U.S. presidential election cycle. 2026 is a midterm election year. Markets often exhibit distinct patterns tied to fiscal and monetary policy shifts within this cycle. In 24 historical midterm election years, this 60-day window was positive 11 times with an average return of -0.1%.
Seasonal patterns reflect historical tendencies and do not guarantee future results. All projections are based on past performance and should be used as one input among many in your investment decision-making process. Data provided by TradeWave.ai.
Explore More
Other markets with seasonal analysis and recent pattern articles.