Crude Oil (WTI)
West Texas Intermediate (WTI) crude oil is the primary benchmark for U.S. oil pricing. It is one of the most actively traded commodities in the world.
Near-term seasonal signals for WTI crude are sending mixed messages. The last 10 years show a 70% win rate over 30 days but project a slight decline to $85.44. Midterm election years tell a different story: the 60-day window carries a 70% win rate with a projected gain to $88.28, meaningfully outperforming the broader 10-year average return of just 1.14% over the same horizon.
The midterm cycle is the key variable here. Historically, crude strengthens through the middle two quarters of midterm years, with average 60-day returns of 5.69% versus near-flat performance in the general dataset. After today's pullback to $86.06, watch whether price holds above $85 as the critical support level confirming the midterm seasonal tailwind.
Seasonal Price Projections
Select a historical basis and projection horizon to see where seasonal patterns suggest Crude Oil (WTI) may be headed.
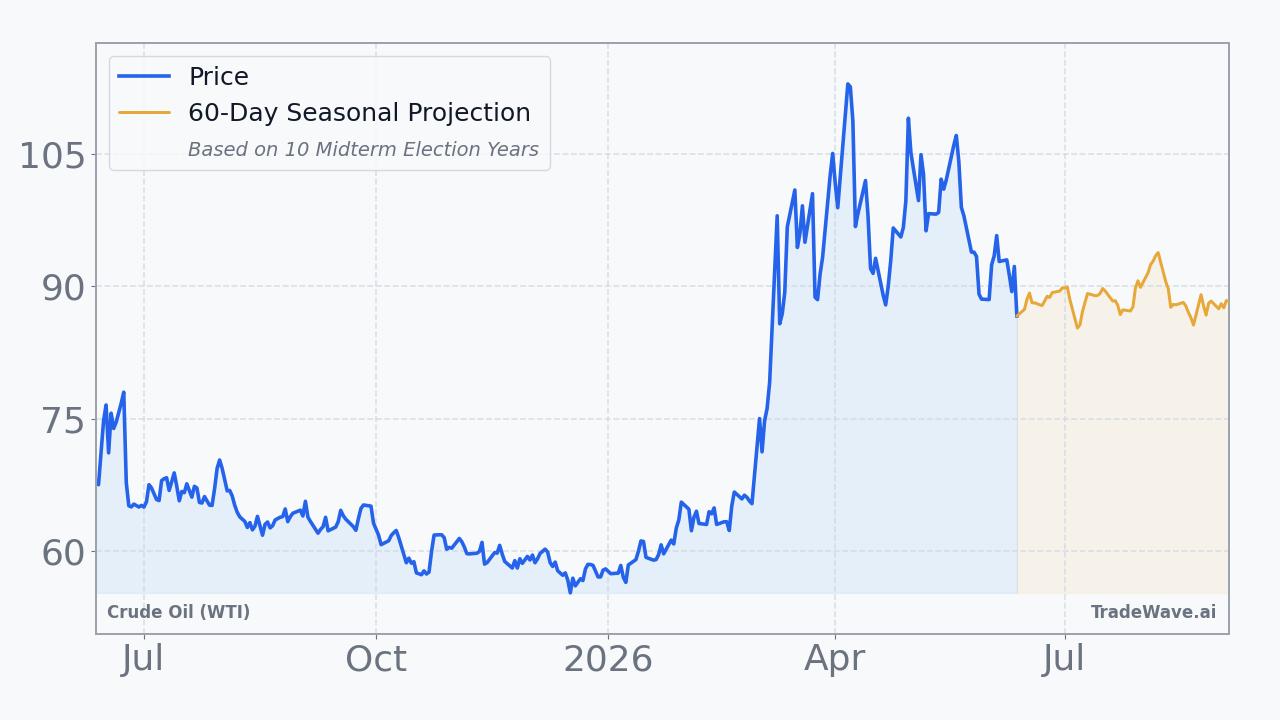
Projection as of Jun 12, 2026 from closing price $86.06
How to Use This Data
Seasonal projection data for Crude Oil (WTI) summarizes how the commodity has historically performed during this same calendar period across past years. The consecutive 60-day win rate of 60.0% means prices finished higher in 60 out of 100 comparable periods, while the midterm election year win rate of 70.0% reflects an even stronger historical tendency during those specific cycles.
When the two bases diverge, as they do here, consecutive history and election-year history are pointing in different directions, suggesting the political calendar may create conditions that differ from recent patterns. The median return is often more reliable than the average because it is less distorted by outlier years like the historical best of +22.7% or worst of -20.9%.
Seasonal patterns cannot account for geopolitical events, supply disruptions, policy shifts, or breaking macroeconomic news that may dominate price action in any given period. A 70.0% win rate still implies a loss occurred in roughly 3 out of 10 historical instances, and no win rate guarantees an outcome in a specific year.
Market participants typically use seasonal data as one layer of context alongside fundamental supply-demand analysis, technical price levels, and broader portfolio risk considerations. It can help frame expectations and timing awareness, but it functions as historical context rather than a directional forecast.
This information is provided for educational purposes only and does not constitute financial advice, a recommendation, or a solicitation to buy or sell any security. Seasonal patterns are based on historical data and do not guarantee future performance. All investment decisions carry risk. Consult a qualified financial advisor before making investment decisions.
Understanding Seasonal Projections
Seasonal projections estimate future price movement based on how Crude Oil (WTI) has historically performed during the same calendar period. These are statistical baselines derived from decades of market data, not predictions.
Consecutive Years (Last 10)
Uses the most recent 10 years of data regardless of market regime. This captures the broadest recent behavior, including all economic and political environments. Over the next 60 trading days, this pattern has been positive 6 of 10 times with an average return of +1.1%.
Midterm Election Years (10 Available)
Uses only years that fall in the same position within the 4-year U.S. presidential election cycle. 2026 is a midterm election year. Markets often exhibit distinct patterns tied to fiscal and monetary policy shifts within this cycle. In 10 historical midterm election years, this 60-day window was positive 7 times with an average return of +5.7%.
Seasonal patterns reflect historical tendencies and do not guarantee future results. All projections are based on past performance and should be used as one input among many in your investment decision-making process. Data provided by TradeWave.ai.
Latest News
Recent headlines related to Crude Oil (WTI), sourced from major financial news outlets with AI sentiment analysis.
- Analyst Trims Patterson-UTI Energy (PTEN) Price Target by $10
- Here is Why Chevron (CVX) is among the 10 High Yield Crude Oil Stocks to Buy Now
- Asian shares surge and oil prices slip after Trump claims a breakthrough in Iran war talks
- Wall Street indexes jump; Trump says strikes against Iran canceled
- CME Group to Expand 24/7 Trading for WTI Crude Oil and Gold
- Update: US Equity Indexes Jump, Crude Oil Sinks as Trump Hopeful of Signing Iran Peace Deal This Weekend
- How major US stock indexes fared Thursday 6/11/2026
- Update: Wall Street Logs Best Day in 2 Months as Trump Sparks Hope For Iran Deal
- US Equity Markets End Higher After Lower-Than-Expected Core Producer Price Inflation, US-Iran Agreement Progress
- Dow Rallies 900 Points on Fresh Hopes for Iran Talks
Explore More
Other markets with seasonal analysis and recent pattern articles.